DataViz

Networks

Dung beetle-feeding trophic networks depicting dung beetle-dung interactions in a Singapore forest fragment

Code
# Setup
library(r2d3)
library(bipartite)
library(tidyverse)
library(bipartiteD3)

# Read data
MR <- read.csv('data/matrix_MR.csv', header = T)

# Prepare data matrix
colnames(MR)[1]<-"Dung"
row.names(MR)<-MR$Dung
MR <- MR %>% select(-Dung) %>% t  %>% as.matrix()

# Sort dung types
SortSec <- c('Tiger','Tapir','Sun bear','Python','Sambar','Civet')

# Set manual colours
ManualColours <- c(Tiger="#ff7f0e", Tapir="#393b79", 'Sun bear' ="#1f77b4", 
                   Sambar = "#8c564b", Python="#7b4173", Civet="#bcbd22")

# Plot
bipartite_D3(MR, PrimaryLab = 'Dung Beetle',
             SecondaryLab = 'Dung Type',
             SortSecondary=SortSec, colouroption = 'manual',
             NamedColourVector = ManualColours, ColourBy = 2,
             Pad = 5)

Data obtained from: Ong et al. 2020

Mapping

Map of Singapore’s parks and nature reserves

Code
# Load packages
library(tidyverse)
library(crosstalk)
library(leaflet)
library(leaflet.extras2)
library(shiny)

# Read data
parks <- read.csv("data/sg_parks.csv", header = T,
                     fileEncoding = "UTF-8-BOM")
shared_parks <- SharedData$new(parks)

# Map with Leaflet & crosstalk
bscols(widths = c(8, 4),
  leaflet(parks) %>% 
    addCircles(lng = ~longitude,
               lat = ~latitude,
               color = c("#0c6332"),
               popup = paste(parks$name)) %>%
    addProviderTiles(providers$Stamen.Watercolor),
  list(filter_select("Name of Park/Nature Reserve",
                     "Name of Park/Nature Reserve",
                     shared_parks, ~name)
  )
)

Data obtained from data.gov.sg

Map of GBIF insect species records from the top 10 insect orders recorded in Southeast Asia from 2001 to 2020

Code
# Setup
library(tidyverse)
library(map)
library(paletteer)
windowsFonts(Roboto=windowsFont("Roboto Condensed")) # Plot font setup :)

# Read data
## GBIF data downloaded using rgbif and cleaned with CoordinateCleaner
SEA_GBIF_cleaned <- read.csv("outputs/GBIF/SEA_GBIF_cleaned.csv")

# Filter to top 10 insect order
order_filter <- c("Lepidoptera",
                  "Hymenoptera",
                  "Coleoptera",
                  "Diptera",
                  "Odonata",
                  "Hemiptera",
                  "Orthoptera",
                  "Trichoptera",
                  "Blattodea",
                  "Mantodea")

SEA_GBIF_top10 <- SEA_GBIF_cleaned %>% filter(order %in% order_filter)

# Map data
map_world <- borders(database = "world", fill="lightgray", colour = "white") 

SEA_GBIF_map <- SEA_GBIF_top10 %>% 
             ggplot(aes(x = decimalLongitude,
                        y = decimalLatitude,
                        colour = order)) +
             map_world +
             geom_point(size = 0.6, alpha = 0.5) +
             coord_equal(xlim = c(90, 150),
                         ylim = c(-12, 30)) +
             labs(colour = "Top 10 Insect Orders") +
             scale_colour_paletteer_d("RColorBrewer::Spectral") +
             guides(color = guide_legend(override.aes = list(size = 3, alpha = 1))) +
             theme_minimal() +
             theme(text = element_text(family = "Roboto",
                                       size = 14))

Data obtained with rgbif.

Charts

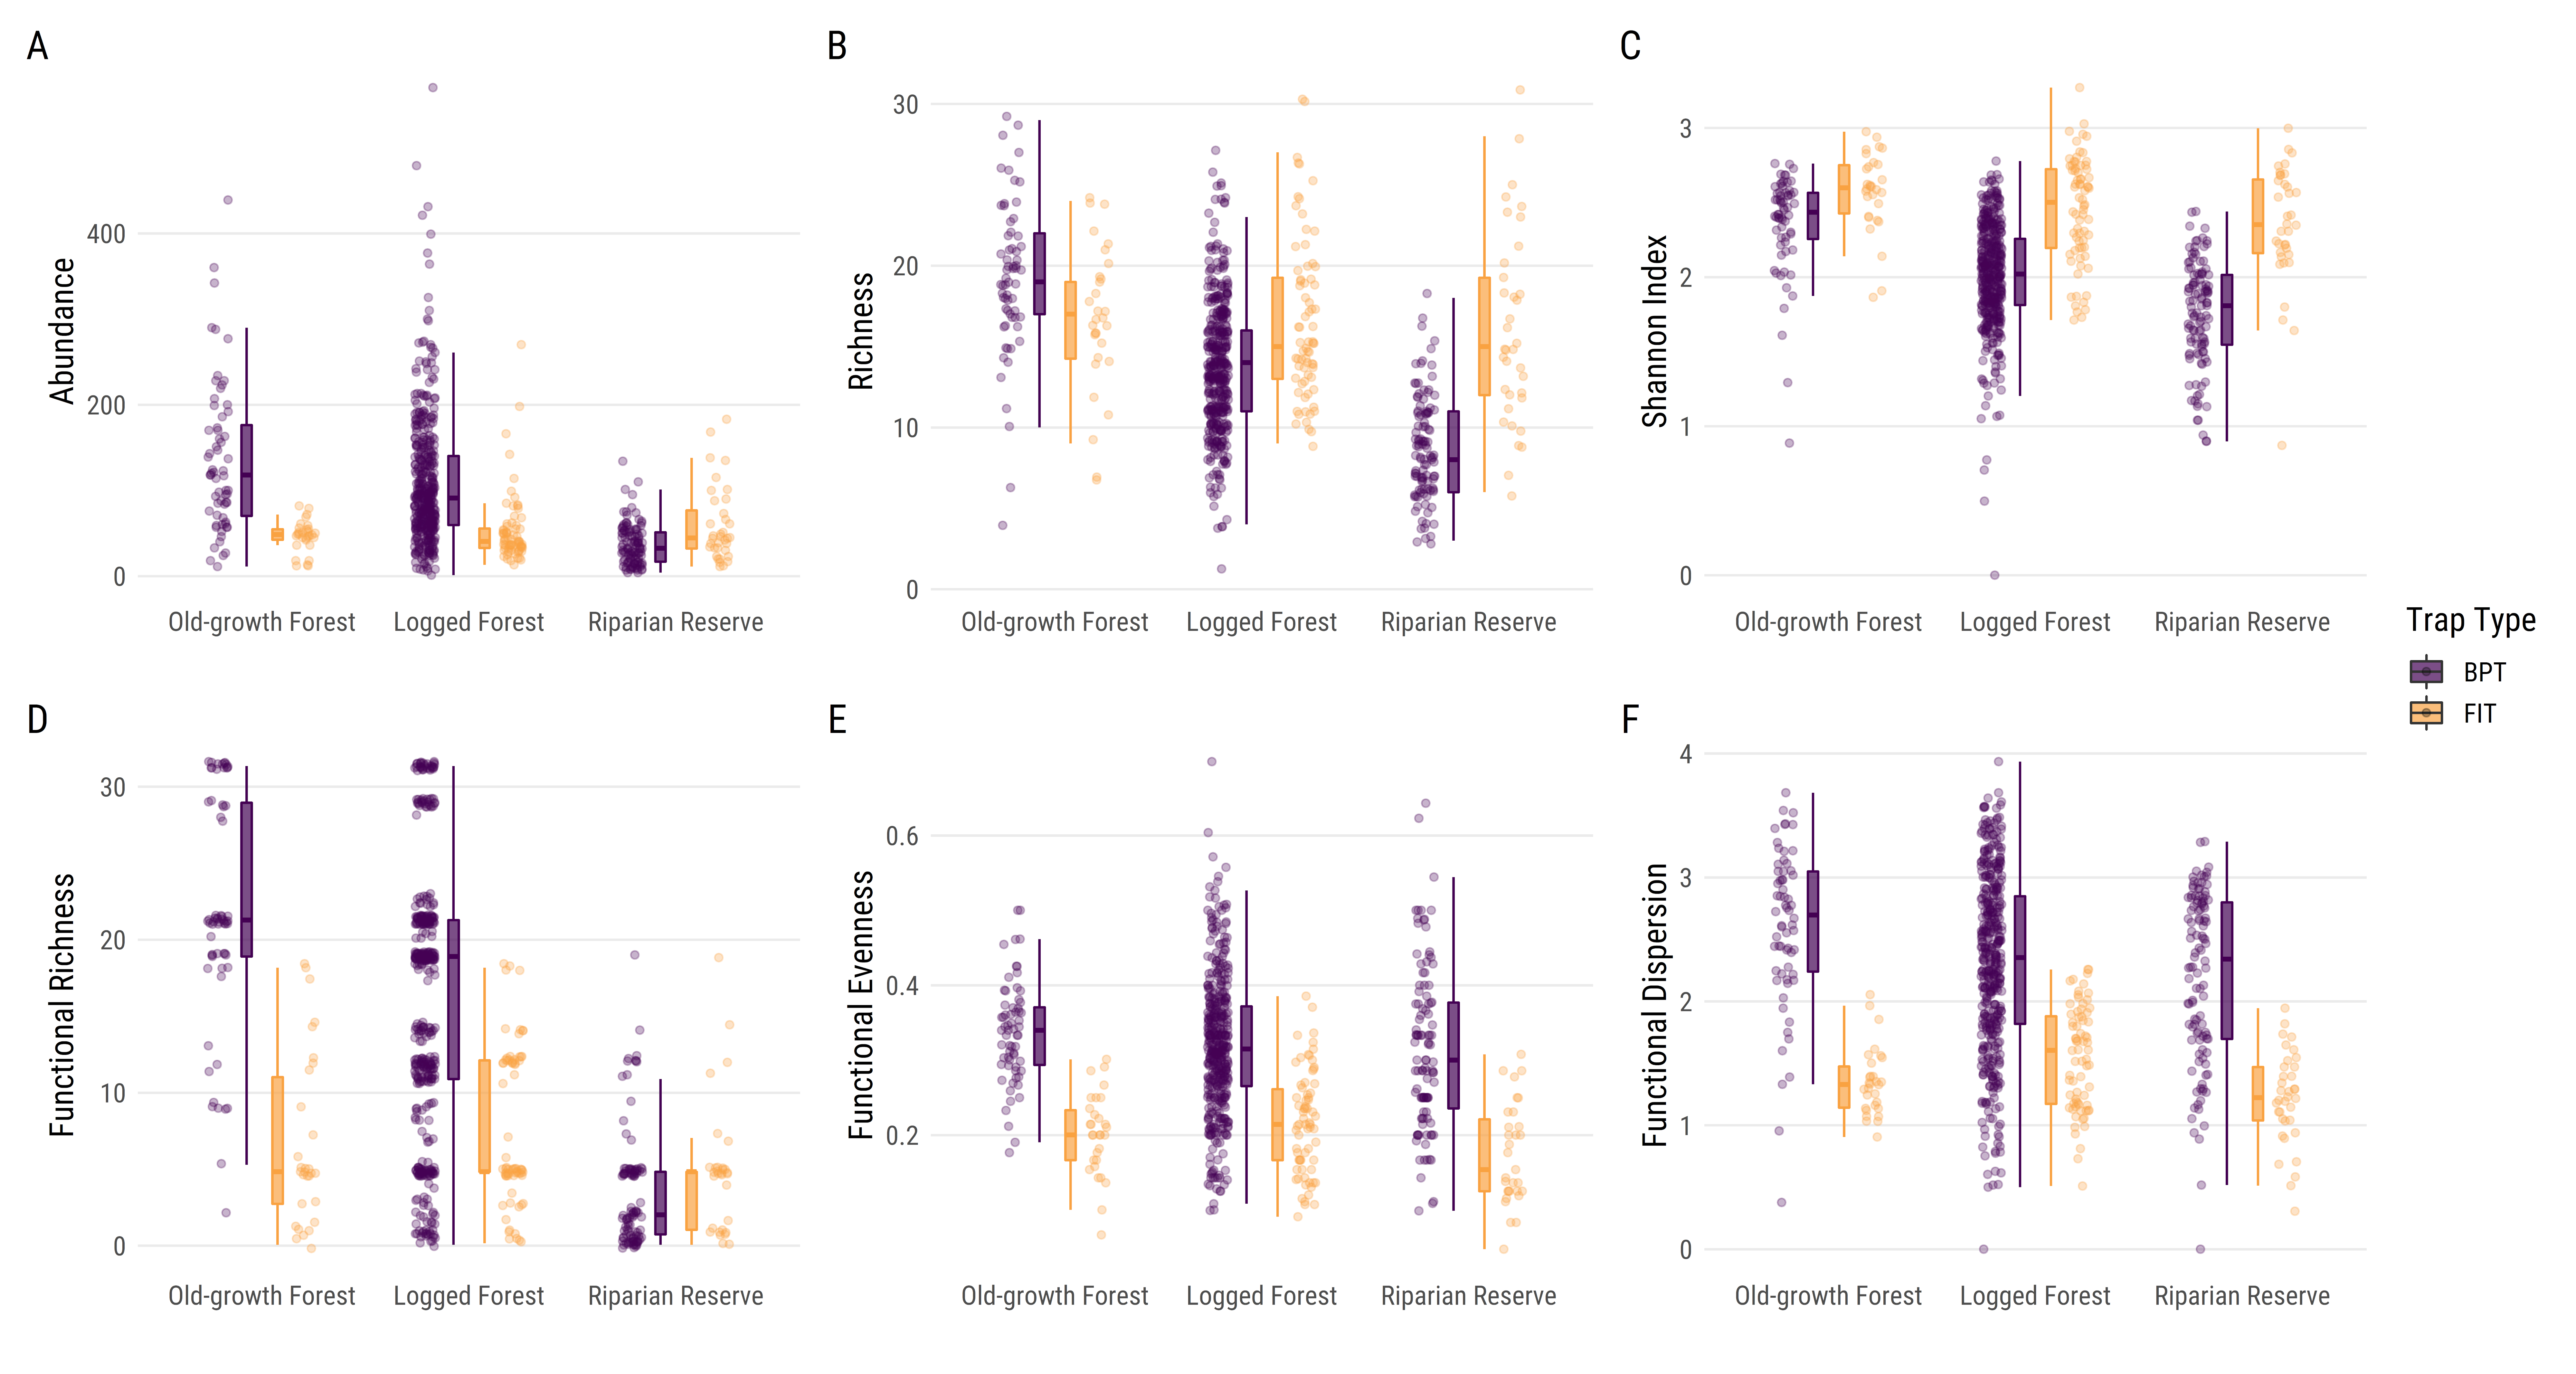
Observed taxonomic and functional metrics for dung beetle communities attracted to baited pitfall traps and flight interception traps across three habitat types in a Bornean rainforest

Code
# Setup
library(tidyverse)
library(patchwork)

windowsFonts(Roboto=windowsFont("Roboto Condensed"))

# Read data
complete_metrics <- read.csv("Outputs/updated aug 2021/metrics/complete_metrics.csv", 
                             header = T, fileEncoding="UTF-8-BOM")

# Prepare individual plots
complete_abd_p <- ggplot(complete_metrics, aes(x = habitat, y = abundance,
                             colour = trap, fill = trap)) +
                  geom_boxplot(width = 0.1, outlier.shape = NA, alpha = 0.7, 
                               position = position_dodge(0.3) ) +
                  geom_point(
                    size = 1.3,
                    alpha = .3,
                    position = position_jitterdodge(dodge.width = 0.85,
                                                    jitter.width = 0.1)) +
                  xlab("") +
                  ylab("Abundance") +
                  scale_colour_manual(values = c("#440154FF", "#F9A242FF"),
                                      guide = "none") +
                  scale_fill_manual(name = "Trap Type",
                                    values =c("#440154FF", "#F9A242FF")) +
                  scale_x_discrete(limits = c("Old-growth Forest",
                                              "Logged Forest",
                                              "Riparian Reserve")) +
                  theme_minimal() +
                  theme(panel.grid.minor.y = element_blank(),
                        panel.grid.major.x = element_blank(),
                        text = element_text(family = "Roboto",
                                              size = 14))

complete_rich_p <-ggplot(complete_metrics, aes(x = habitat, y = richness,
                             colour = trap, fill = trap)) +
                  geom_boxplot(width = 0.1, outlier.shape = NA, alpha = 0.7, 
                               position = position_dodge(0.3) ) +
                  geom_point(size = 1.3, alpha = .3,
                            position = 
                            position_jitterdodge(dodge.width = 0.85, 
                                                 jitter.width = 0.1,
                                                 jitter.height = 0.35)) +
                  xlab("") +
                  ylab("Richness") +
                  scale_colour_manual(values = c("#440154FF", "#F9A242FF"),
                                      guide = "none") +
                  scale_fill_manual(name = "Trap Type",
                                    values =c("#440154FF", "#F9A242FF")) +
                  scale_x_discrete(limits = c("Old-growth Forest",
                                              "Logged Forest",
                                              "Riparian Reserve")) +
                  theme_minimal() +
                  theme(panel.grid.minor.y = element_blank(),
                        panel.grid.major.x = element_blank(),
                        text = element_text(family = "Roboto",
                                              size = 14)) +
                  theme(legend.position = "none")

complete_shan_p <- ggplot(complete_metrics, aes(x = habitat, y = shannon,
                                               colour = trap, fill = trap)) +
                    geom_boxplot(width = 0.1, outlier.shape = NA, alpha = 0.7, 
                                 position = position_dodge(0.3) ) +
                    geom_point(
                      size = 1.3,
                      alpha = .3,
                      position = position_jitterdodge(dodge.width = 0.85,
                                                      jitter.width = 0.1)) +
                    xlab("") +
                    ylab("Shannon Index") +
                    scale_colour_manual(values = c("#440154FF", "#F9A242FF"),
                                        guide = "none") +
                    scale_fill_manual(name = "Trap Type",
                                      values =c("#440154FF", "#F9A242FF")) +
                    scale_x_discrete(limits = c("Old-growth Forest",
                                                "Logged Forest",
                                                "Riparian Reserve")) +
                    theme_minimal() +
                    theme(panel.grid.minor.y = element_blank(),
                          panel.grid.major.x = element_blank(),
                          text = element_text(family = "Roboto",
                                              size = 14)) +
                    theme(legend.position = "none")

complete_FRic_p <- ggplot(complete_metrics, aes(x = habitat, y = FRic,
                                               colour = trap, fill = trap)) +
                    geom_boxplot(width = 0.1, outlier.shape = NA, alpha = 0.7, 
                                 position = position_dodge(0.3) ) +
                    geom_point(
                      size = 1.3,
                      alpha = .3,
                      position = position_jitterdodge(dodge.width = 0.85,
                                                      jitter.width = 0.1,
                                                      jitter.height = 0.3)) +
                    xlab("") +
                    ylab("Functional Richness") +
                    scale_colour_manual(values = c("#440154FF", "#F9A242FF"),
                                        guide = "none") +
                    scale_fill_manual(name = "Trap Type",
                                      values =c("#440154FF", "#F9A242FF")) +
                    scale_x_discrete(limits = c("Old-growth Forest",
                                                "Logged Forest",
                                                "Riparian Reserve")) +
                    theme_minimal() +
                    theme(panel.grid.minor.y = element_blank(),
                          panel.grid.major.x = element_blank(),
                          text = element_text(family = "Roboto",
                                              size = 14)) +
                    theme(legend.position = "none")

complete_FEve_p <- ggplot(complete_metrics, aes(x = habitat, y = FEve,
                                                colour = trap, fill = trap)) +
                    geom_boxplot(width = 0.1, outlier.shape = NA, alpha = 0.7, 
                                 position = position_dodge(0.3) ) +
                    geom_point(
                      size = 1.3,
                      alpha = .3,
                      position = position_jitterdodge(dodge.width = 0.85,
                                                      jitter.width = 0.1)) +
                    xlab("") +
                    ylab("Functional Evenness") +
                    scale_colour_manual(values = c("#440154FF", "#F9A242FF"),
                                        guide = "none") +
                    scale_fill_manual(name = "Trap Type",
                                      values =c("#440154FF", "#F9A242FF")) +
                    scale_x_discrete(limits = c("Old-growth Forest",
                                                "Logged Forest",
                                                "Riparian Reserve")) +
                    theme_minimal() +
                    theme(panel.grid.minor.y = element_blank(),
                          panel.grid.major.x = element_blank(),
                          text = element_text(family = "Roboto",
                                              size = 14)) +
                    theme(legend.position = "none")

complete_FDis_p <- ggplot(complete_metrics, aes(x = habitat, y = FDis,
                                                colour = trap, fill = trap)) +
                    geom_boxplot(width = 0.1, outlier.shape = NA, alpha = 0.7, 
                                 position = position_dodge(0.3) ) +
                    geom_point(
                      size = 1.3,
                      alpha = .3,
                      position = position_jitterdodge(dodge.width = 0.85,
                                                      jitter.width = 0.1)) +
                    xlab("") +
                    ylab("Functional Dispersion") +
                    scale_colour_manual(values = c("#440154FF", "#F9A242FF"),
                                        guide = "none") +
                    scale_fill_manual(name = "Trap Type",
                                      values =c("#440154FF", "#F9A242FF")) +
                    scale_x_discrete(limits = c("Old-growth Forest",
                                                "Logged Forest",
                                                "Riparian Reserve")) +
                    theme_minimal() +
                    theme(panel.grid.minor.y = element_blank(),
                          panel.grid.major.x = element_blank(),
                          text = element_text(family = "Roboto",
                                              size = 14)) +
                    theme(legend.position = "none")

# Patch plots together
complete_raw_patch <- complete_abd_p + complete_rich_p + complete_shan_p + 
                      complete_FRic_p + complete_FEve_p + complete_FDis_p + 
                      plot_layout(ncol = 3, guides = 'collect') + 
                      plot_annotation(tag_levels = 'A') &
                      theme(text = element_text('Roboto'))

Source: Ong et al. 2021

Tutorials

These tutorials were created (or adapted from other teaching resources) for the ES3307/7028 Experimental Design & Analysis for Ecology course taught by Asst Prof Eleanor Slade.